Dashboard
Database card link
By clicking on the name of your database on the database card you will be brought to a database dashboard the will contain information about your Devii connection with your database, links to manage roles, policies, GraphiQL interface, editing whitelist tables, viewing the system logs and introspecting the database.
At this point you have 'switched' roles from Devii Portal login to Devii Root role, the password will need to be changed please refer to change Root password for instructions on changing your Devii Root role password.
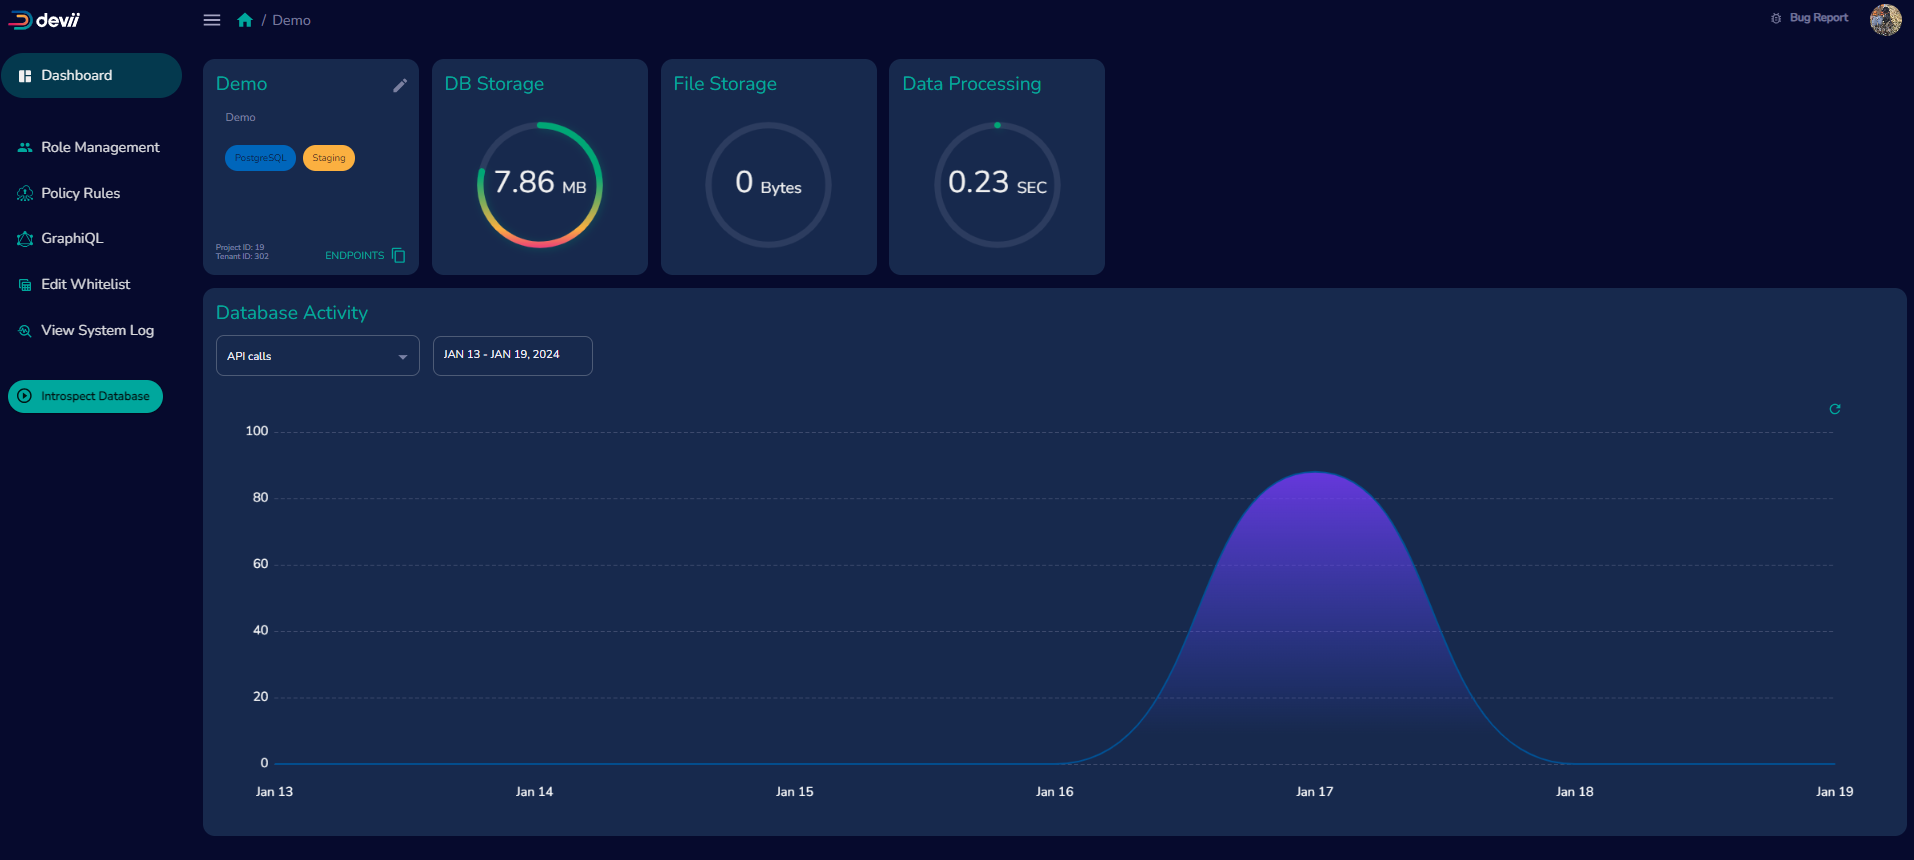
Storage and Processing Charts
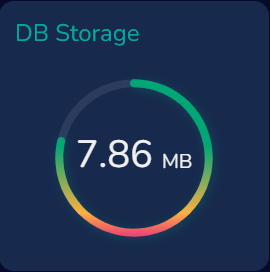
Database Storage
The Portal's database storage card provides an overview of your connected database current size. It employs a ring system that utilizes percentage increments, tracking progress towards the next 10x capacity. In this case, the database storage increments are set at 10MB. As your database storage surpasses the initial 10MB threshold, the maximum capacity dynamically adjusts, growing to 100MB.
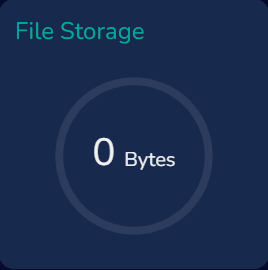
File Storage
The Portal's file storage card works in the same way the database storage card, however in the example below there is no file storage and the maximum capacity is set at 10 bytes and will increase in the same way as the database storage card.
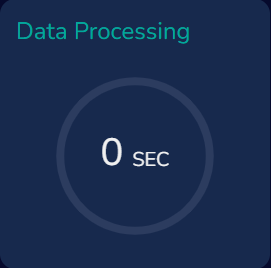
Data Processing
The data processing card in the Devii Portal app displays the server processing usage and remaining processing time, measured in hours, for your connected database.
Database Activity Charts
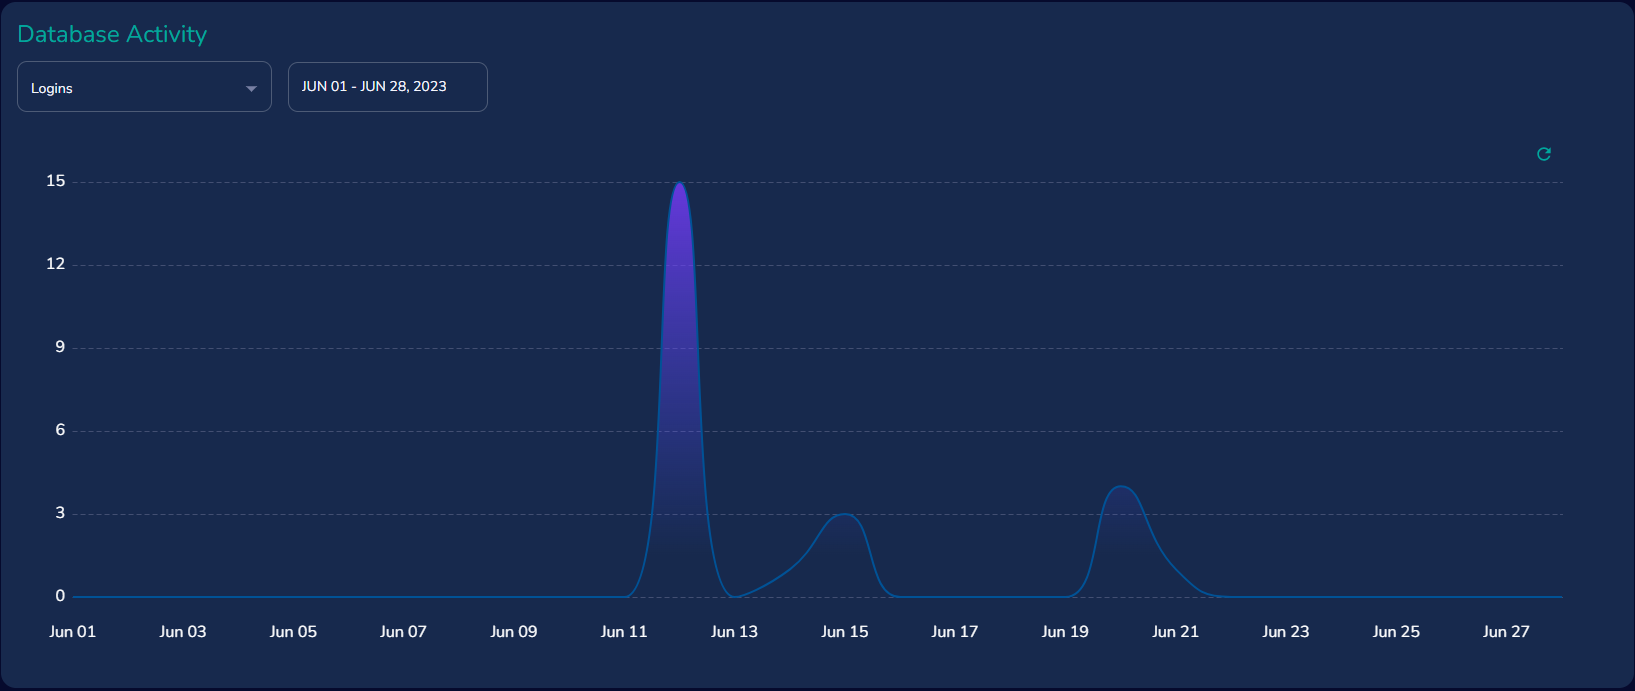
The bottom half of the dashboard contains information about your Devii database connection activity. You can get information about the amount of API calls, Data Processing, Registrations and Logins from the drop down menu. The database activity monitor can also adjust the date range by clicking in the "Date Range" box a menu will appear that will allow this adjustment.
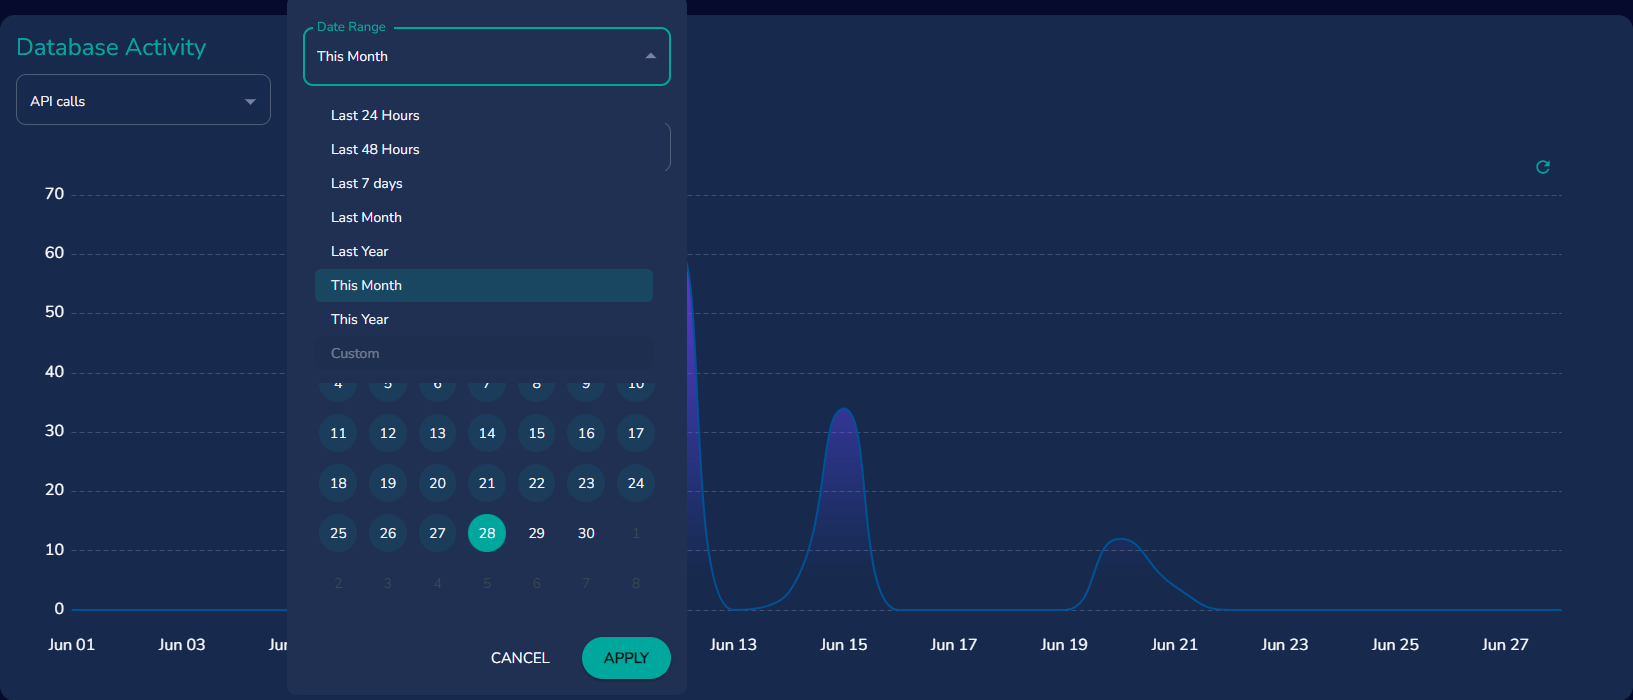
API Calls
The count of API calls within the specified date range.
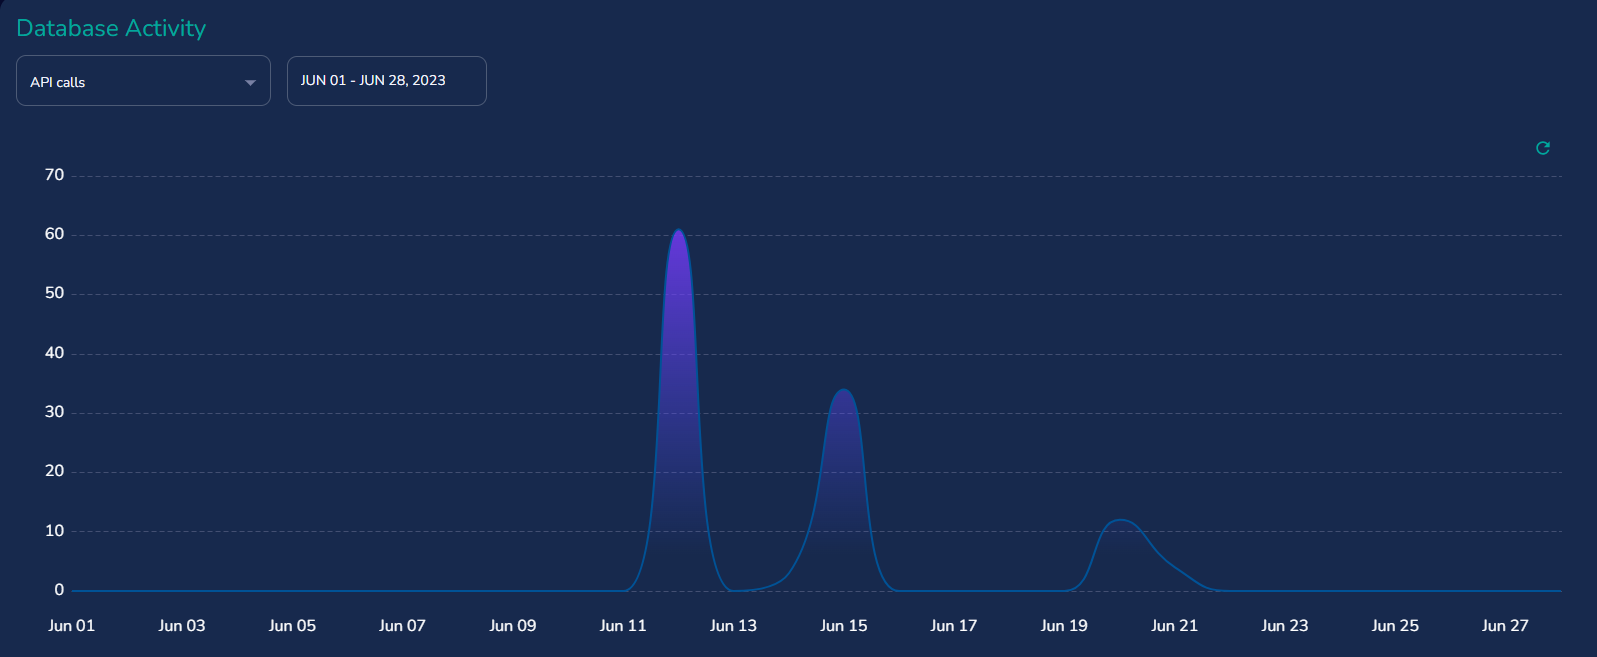
Data Processing
The processing time of the database connection in hours within a specified date range.
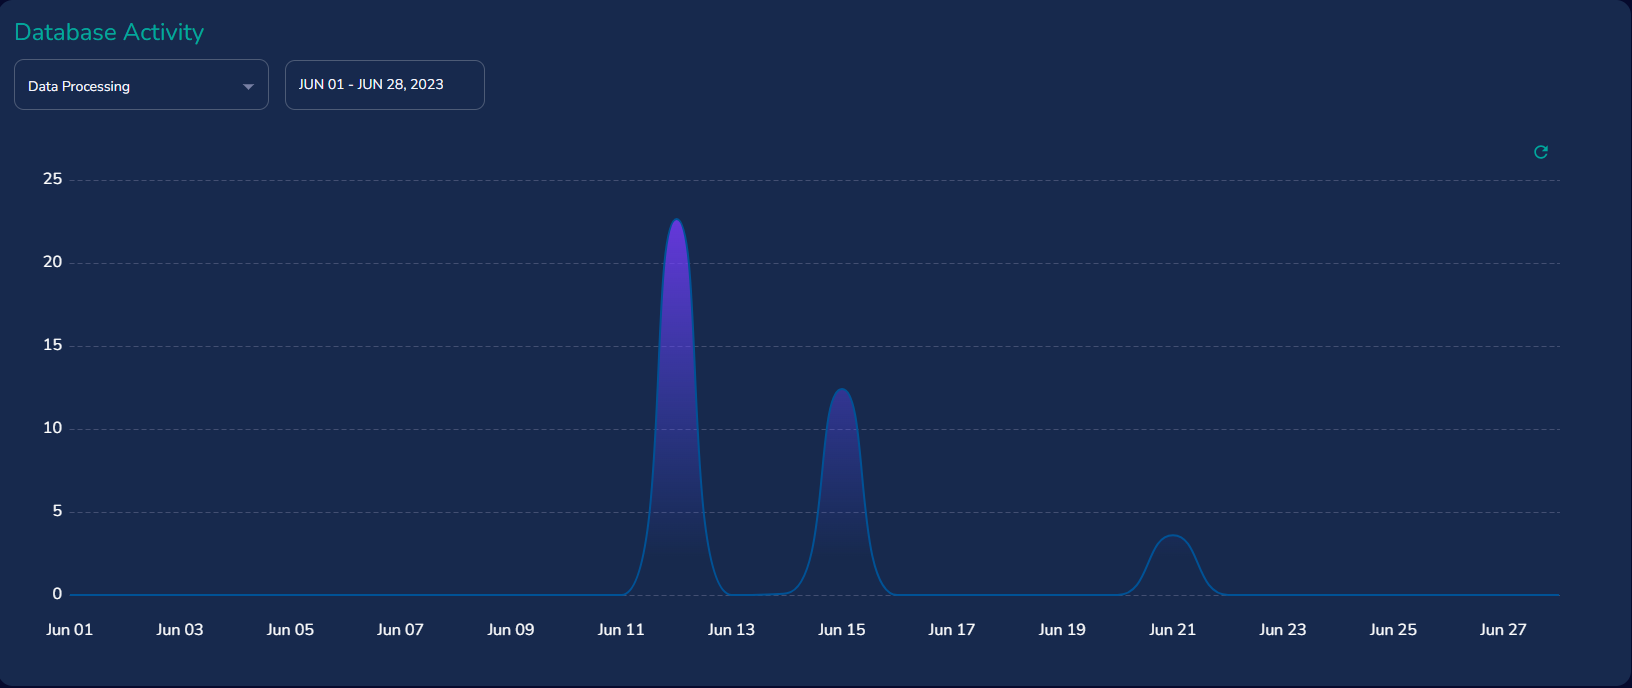
Registrations
The count of roles added to the database connection within a specified date range.
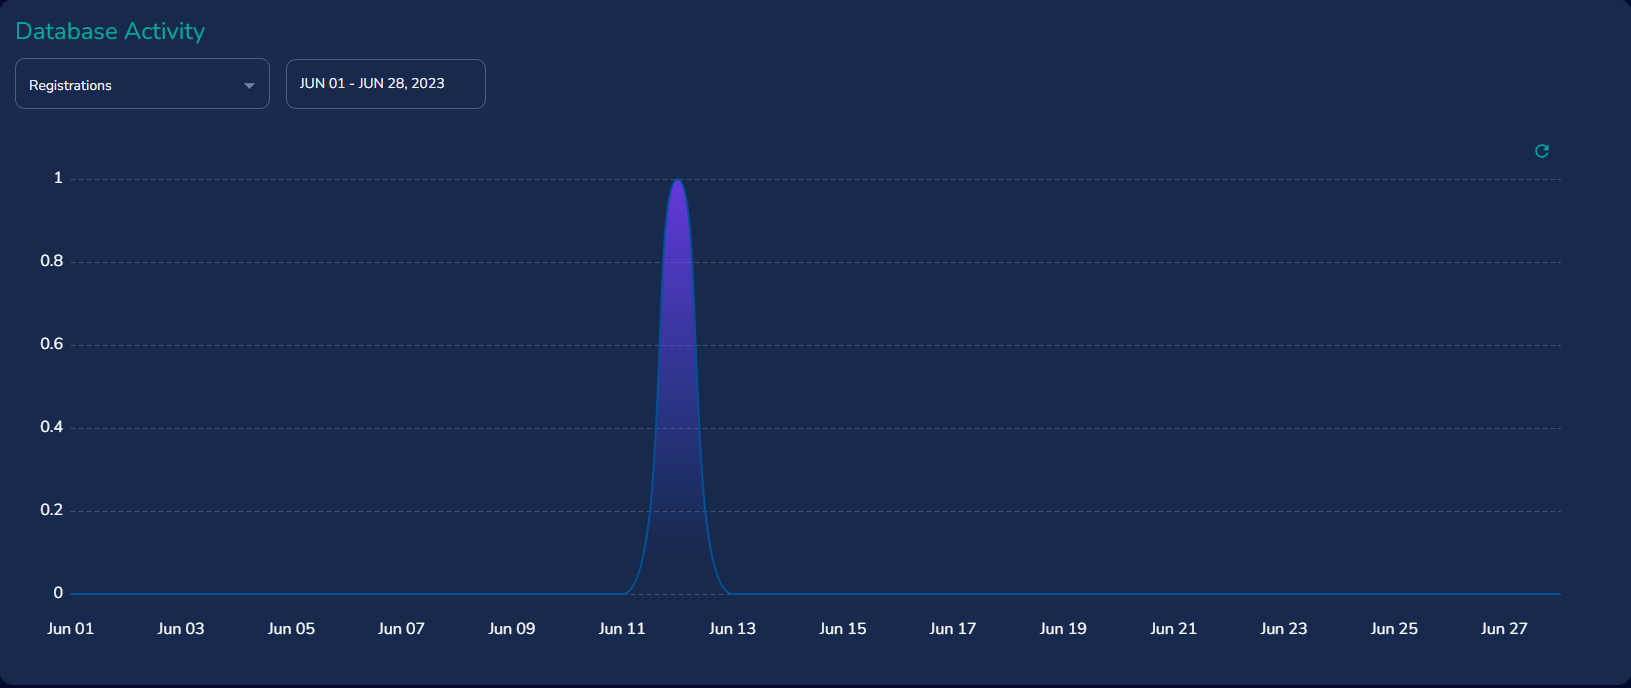
Logins
The count of logins to the database connection within a specified date range.
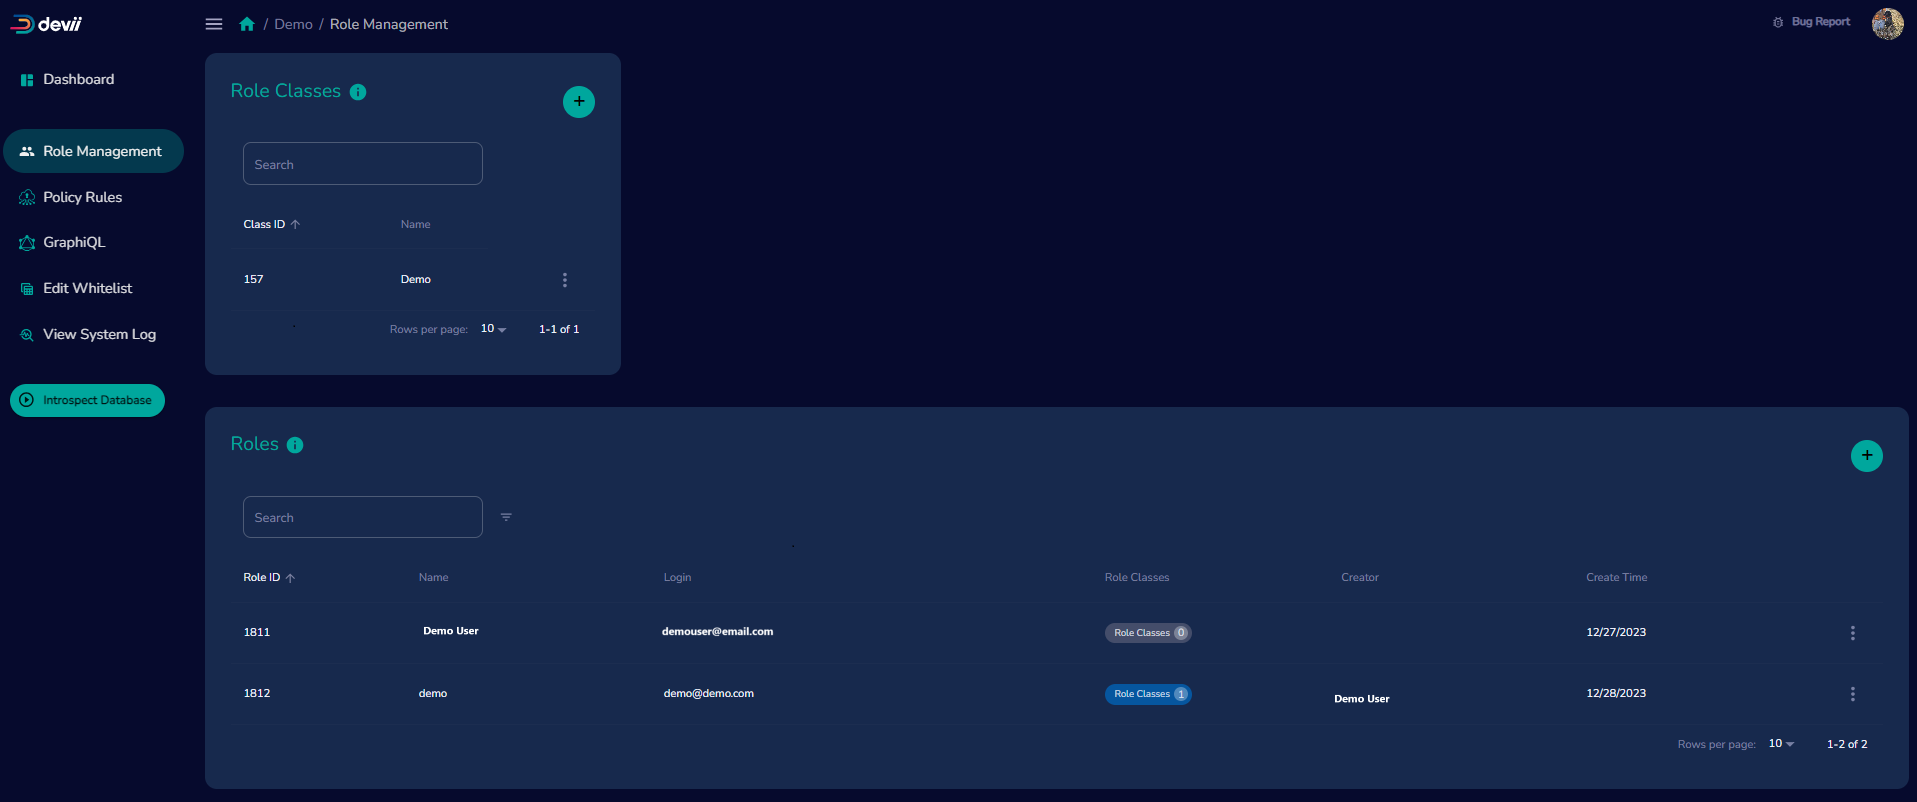
Role Management
Please see our Role Management document for more details...
Policy Rules
Please see our Policy Rules document for more details...

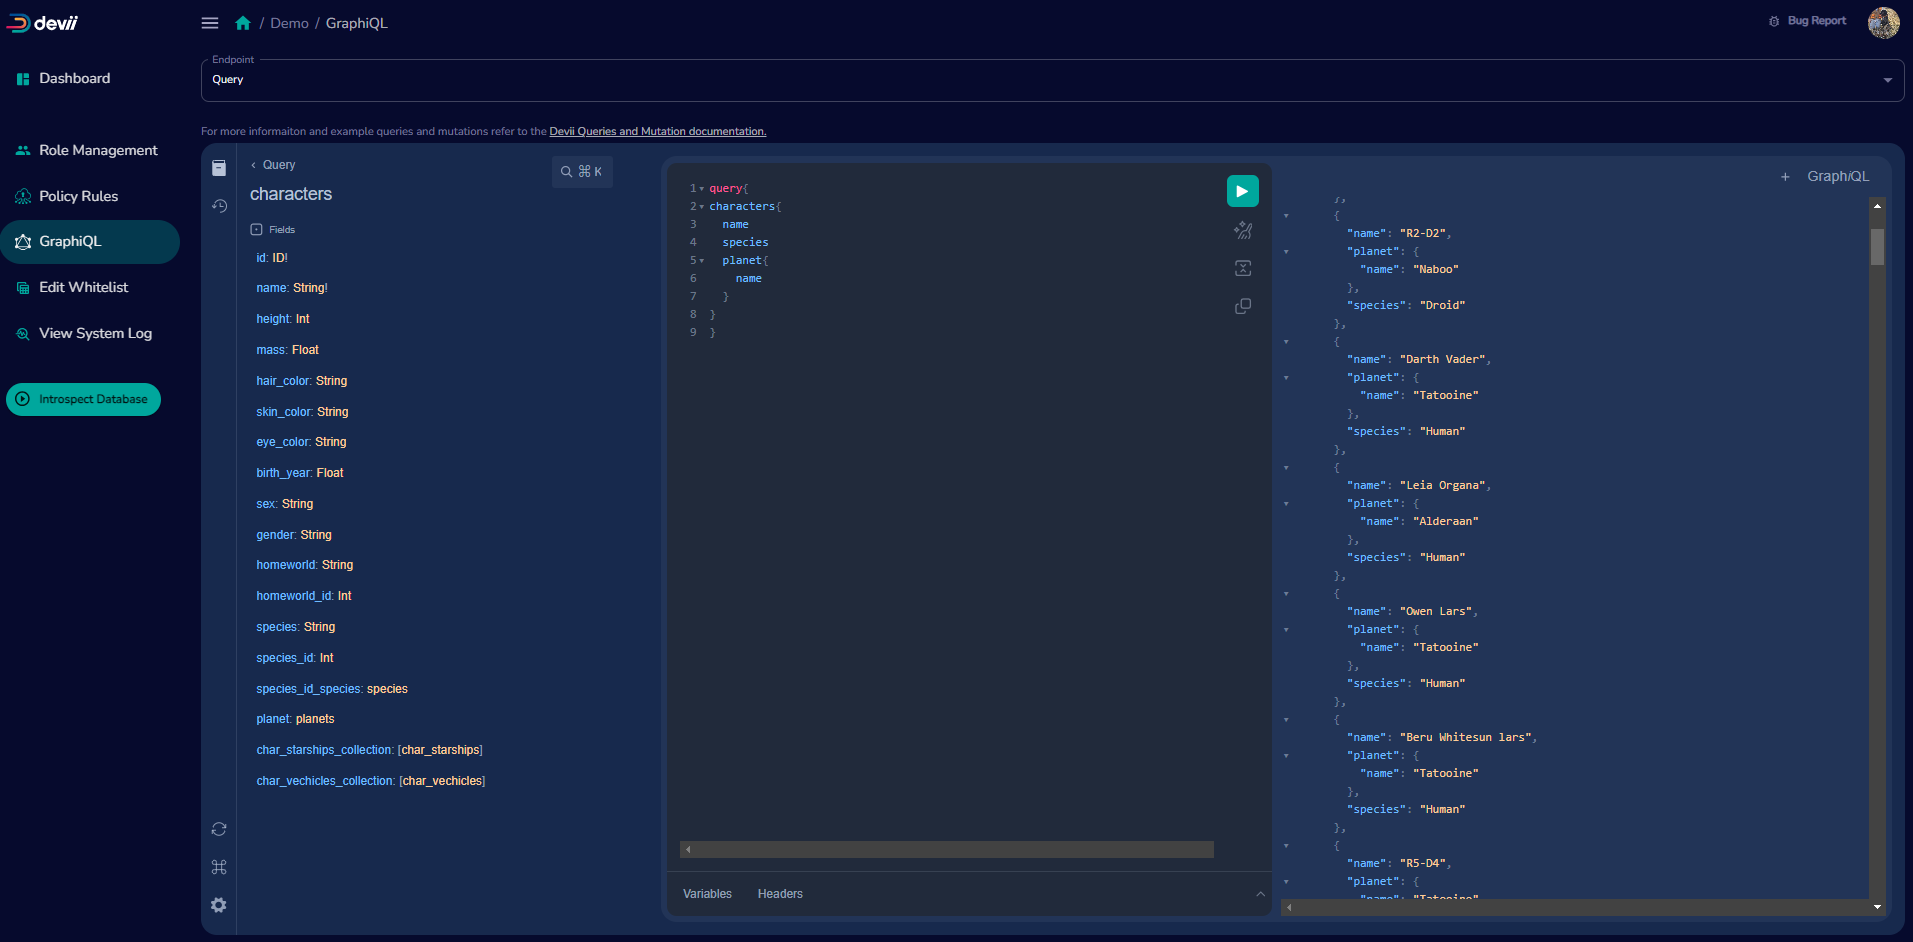
GraphiQL
The portal has builtin GraphiQL to test queries and mutations prior to adding to your application.
Official Documentation:
https://github.com/graphql/graphiql/blob/main/README.md
and
https://github.com/graphql/graphiql/tree/main/packages/graphiql#readme
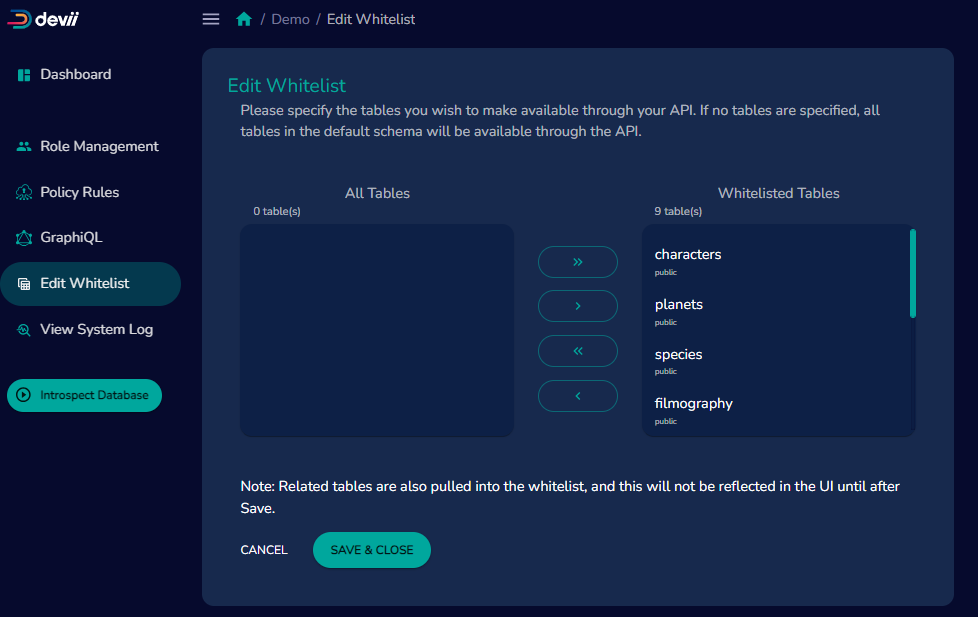
Edit Whitelist
You can add or remove tables to your whitelist at any time after you have added your database.
you will need to wait for Devii to finish introspection before the tables will show up, it should take less than 10 seconds.
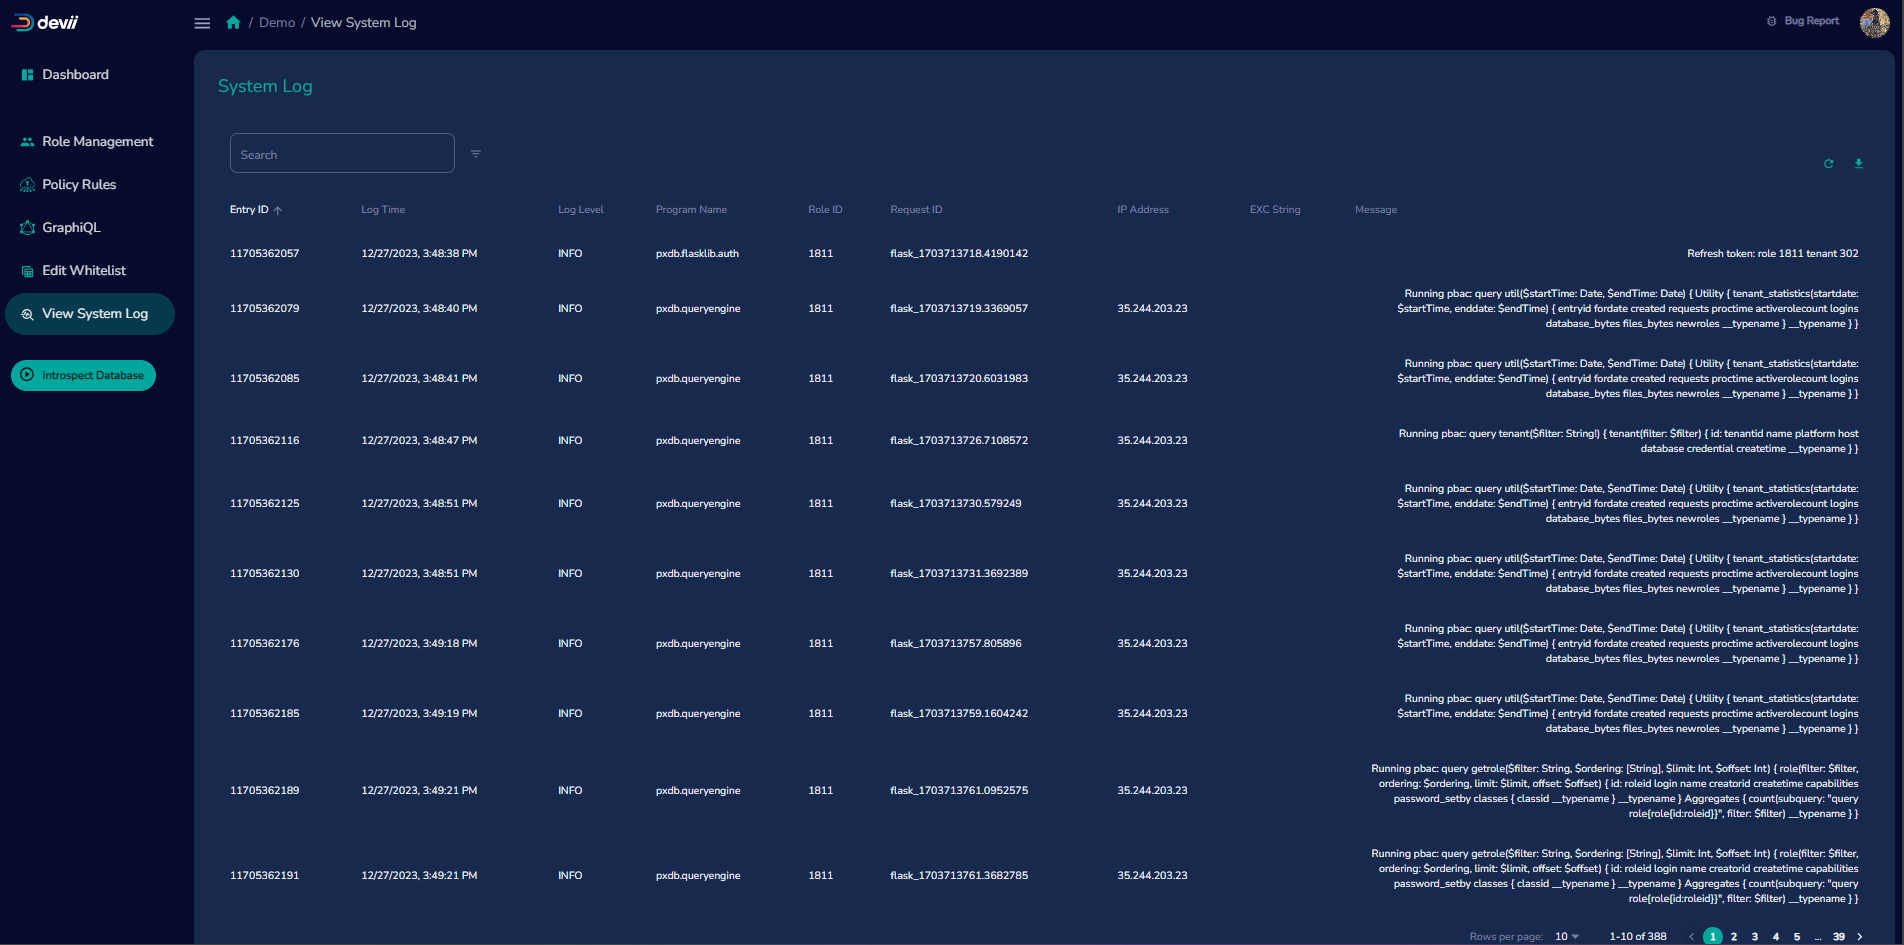
View System Logs
To aid in reporting bugs or additional reporting you may wish to complete, we have made your tenant system logs available to you, he IP address has been removed in this image for security but, it will be available when you view the logs..
Introspect Database
Any time changes are made to the underlying database it must under go a introspection in order for Devii to make the correction connections to the database for queries and mutations.
To introspect your database after changes, click on the green "Introspect Database" button on the left side of the portal.
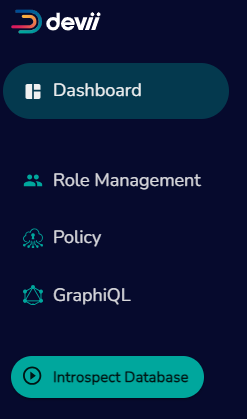
Once the introspection has finished a message will popup in the bottom left side of the screen.
Go Back to Databases
If you are inside the dashboard of a specific database and wish to go back and see all of your Devii connected databases, click on the Devii logo or the home button in the upper right of the portal screen.